Green Lights All the Way Down: Why Passing Every Check Doesn't Mean Your System Is Healthy
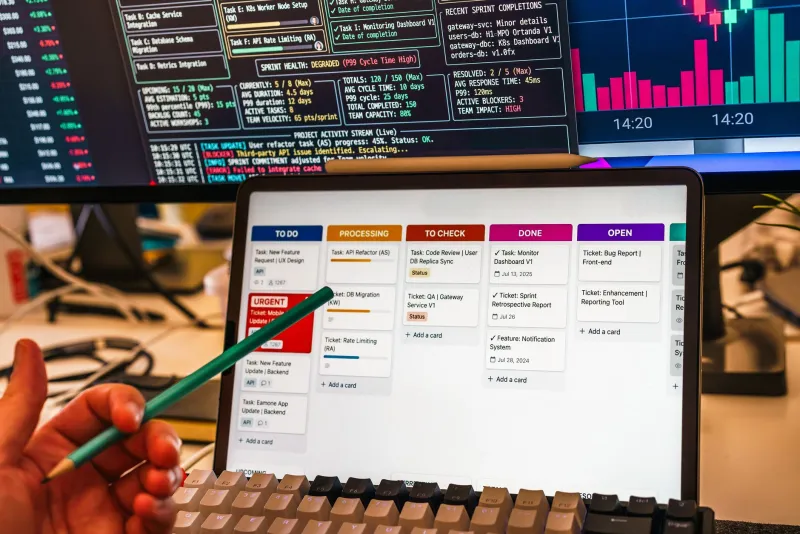
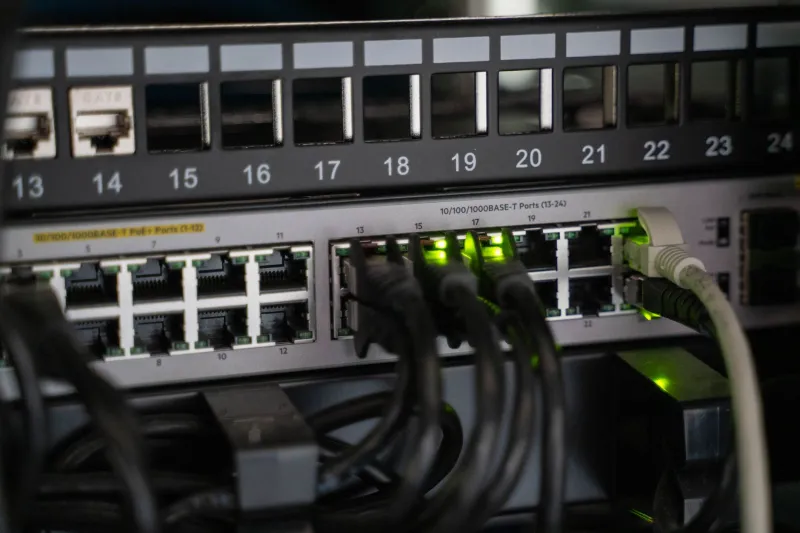
The dashboard is clean. Test suites are green. The monthly SLA report shows four nines. And somewhere, right now, a subset of your users is experiencing something that none of those instruments have registered—a timeout on a specific network path, a rendering failure on a device configuration your test matrix does not include, a race condition that only manifests under a traffic pattern that synthetic monitoring was never designed to simulate.
Reliability engineering has a measurement problem. Not a tooling problem, not a process problem—a measurement problem. The instruments used to assess system health are calibrated to the failure modes that engineers anticipated when they designed those instruments. The failures that actually reach users are disproportionately the ones nobody thought to test for.
The Confidence Architecture
Modern engineering organizations have built elaborate structures for generating confidence in their systems. Unit tests validate individual functions. Integration tests verify that components interact correctly. End-to-end tests simulate user journeys through controlled environments. Synthetic monitoring probes production endpoints on a schedule. SLA calculations aggregate uptime data into percentages that appear in executive dashboards and customer contracts.
Each of these practices is individually reasonable. Together, they create what might be called a confidence architecture—a layered system of checks that, when all indicators are positive, produces a strong organizational conviction that the system is working.
The problem is that this architecture is self-referential. It measures the system against the expectations that were encoded into the tests and monitors. It cannot, by construction, detect failures that were not anticipated at the time those expectations were encoded.
This is not a theoretical concern. It is the mechanism behind a significant proportion of production incidents that post-mortems describe as "unexpected" or "not caught by existing tests."
Where Synthetic Monitoring Falls Short
Synthetic monitoring is a valuable tool. Probing known endpoints from known locations on a known schedule provides reliable detection of a specific class of failure: complete unavailability of a service path that the monitoring configuration knows about.
What it cannot detect is considerably broader. Synthetic probes originate from a small number of network locations, typically operated by the monitoring vendor. They do not represent the diversity of network paths, ISPs, and last-mile conditions that real users traverse. A CDN misconfiguration that degrades performance for users on mobile carriers in the Southeast may produce no signal in a synthetic monitoring system whose probes originate from data centers in Virginia and Oregon.
Synthetic probes also execute in isolation. They do not contend with the concurrent load, session state, or data conditions that real user requests encounter. A probe that successfully completes a checkout flow in two seconds does not tell you what happens to the same flow when the session cache is under pressure, the inventory service is experiencing elevated latency, and the payment processor is approaching its rate limit simultaneously.
Perhaps most importantly, synthetic monitoring tests the paths that someone decided to monitor. User journeys that were not included in the monitoring configuration are invisible to it, regardless of how frequently real users traverse them.
The SLA Math Problem
Service level agreements expressed as uptime percentages have a specific and well-documented limitation: they measure availability at the level of the system, not the level of the user experience.
Consider a service that is "available" by every technical measure—endpoints are responding, health checks are passing, error rates are within threshold—but is returning degraded results for a specific query pattern that affects a meaningful segment of users. The SLA calculation does not register this as a failure. The users experiencing it do not share that assessment.
Further, aggregate uptime figures obscure distribution. A system that is fully available 99.9 percent of the time but experiences complete outages during peak traffic windows—the hours when user density is highest—is delivering a substantially worse user experience than the aggregate number suggests. The math is accurate; the inference it supports is misleading.
Organizations that have shifted to error budget frameworks have partially addressed this by treating SLOs as consumption targets rather than binary thresholds. But even error budgets depend on the quality of the signals feeding them. An error budget calculated from synthetic probe data inherits all of the blind spots of synthetic monitoring.
Surfacing What Traditional QA Cannot Reach
Addressing the reliability gap requires deliberately seeking out failure modes that existing instruments are not designed to detect.
Real user monitoring at the session level captures what synthetic monitoring cannot: the actual experience of actual users traversing actual network paths with actual device configurations. Instrumenting client-side performance data—not just server-side response times—and correlating it with user-visible outcomes provides a fundamentally different signal than any probe-based approach.
Property-based testing extends unit and integration testing by generating inputs algorithmically rather than relying on manually specified test cases. Where example-based tests verify that the system behaves correctly for the scenarios a developer imagined, property-based tests probe the boundary conditions and edge cases that developers did not. Tools in this space have matured considerably, and the investment in adopting them pays dividends in categories of failure that traditional test suites systematically miss.
Exploratory load testing against production topology goes beyond synthetic benchmarks by simulating the interaction patterns of real traffic—including the correlated spikes, geographic clustering, and session state distributions that characterize actual usage. Load tests run against a single endpoint in isolation tell you something. Load tests that model the full concurrency of a real traffic event tell you considerably more.
Assumption audits are perhaps the least glamorous but most consistently productive technique. For each reliability claim the organization makes—"this service handles X requests per second," "this flow completes in under Y milliseconds"—document the conditions under which that claim was validated. If the conditions bear little resemblance to current production reality, the claim is a liability.
Redefining What Reliability Means
The organizations that close the gap between lab-validated reliability and real-world user experience share a common orientation: they treat reliability as a user outcome, not a system property. The question is not whether the system is up—it is whether users can accomplish what they came to do, at the speed they expect, under the conditions they actually encounter.
Building toward that definition requires measurement instruments calibrated to user experience, not just infrastructure state. It requires test strategies designed to surface unanticipated failures, not merely confirm anticipated successes. And it requires a willingness to treat a clean dashboard with the same skepticism that should greet any instrument whose limitations are not fully understood.
Green lights are not the goal. Reliable outcomes for real users are. The distance between those two things is where the most important reliability engineering work remains to be done.